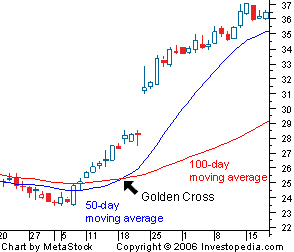
The golden cross is a bullish breakout pattern formed from a crossover involving a security's short-term moving average (such as the 15-day moving average) breaking above its long-term moving average (such as 50-day moving average) or resistance level. As long-term indicators carry more weight, the golden cross indicates a bull market on the horizon and is reinforced by high trading volumes.

BREAKING DOWN 'Golden Cross'
There are three stages to a golden cross. The first stage requires that a downtrend eventually bottoms out as selling is depleted. In the second stage, the shorter moving average forms a crossover up through the larger moving average to trigger a breakout and confirmation of trend reversal. The last stage is the continuing uptrend for the follow through to higher prices. The moving averages act as support levels on pullbacks, until they crossover back down at which point a death cross may form. The death cross is the opposite of the golden cross as the shorter moving average forms a crossover down through the longer moving average.Applications of the Golden Cross
The most commonly used moving averages are the 50-period and the 200-period moving average. The period represents a specific time increment. Generally, larger time periods tend to form stronger lasting breakouts. For example, the daily 50-day moving average crossover up through the 200-day moving average on an index like the S&P 500 is one of the most popular bullish market signals. With a bell weather index, the motto "A rising tide lifts all boats" applies when a golden cross forms as the buying resonates throughout the index components and sectors.
Day traders commonly use smaller time periods like the 5-period and 15-period moving averages to trade intra-day golden cross breakouts. The time interval of the charts can also be adjusted from 1 minute to weeks or months. Just as larger periods make for stronger signals, the same applies for chart time periods as well. The larger the chart time frame, the stronger and lasting the golden cross breakout tends to be. For example, a monthly 50-period and 200-period moving average golden cross is significantly stronger and longer lasting than the same 50.200- period moving average crossover on a 15-minute chart. Golden cross breakout signals can be utilized with various momentum oscillators like stochastic, moving average convergence divergence (MACD) and relative strength index (RSI) to track when the uptrend is overbought and oversold. This helps to spot ideal entries and exits.
By Investopedia
Read more: Simple Moving Average - SMA Definition | Investopedia http://www.investopedia.com/terms/s/sma.asp#ixzz4ZotMiRwpBy Investopedia
Follow us: Investopedia on Facebook


0 comments:
Posting Komentar