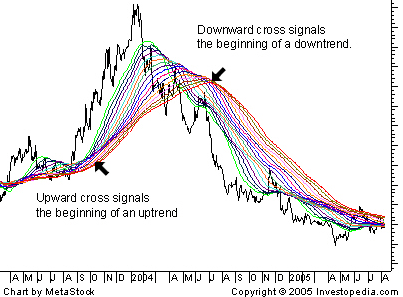
A technique used in technical analysis to identify changing trends. It is created by placing a large number of moving averages onto the same chart. When all the averages are moving in the same direction, the trend is said to be strong. Reversals are confirmed when the averages crossover and head in the opposite direction.

The moving averages used in the diagram start with the 50-day moving average and increase by 10-day periods up to the final average of 200. (50, 60, 70, 80 ... 190, 200)
BREAKING DOWN 'Moving Average Ribbon'
Responsiveness to changing conditions is accounted for by changing the number of time periods used in the moving averages. The shorter the number of periods used to create the average, the more sensitive the ribbon is to slight price changes. For example, a series of 5, 15, 25, 35 and 45-day moving averages will be a better choice to find short-term reversals then 150, 160, 170, 180-day moving averages.
By Investopedia
Read more: Simple Moving Average - SMA Definition | Investopedia http://www.investopedia.com/terms/s/sma.asp#ixzz4Zou8SgGl
Follow us: Investopedia on Facebook


0 comments:
Posting Komentar